Interest rates have real implications in the investment world. So does the forecast about them; hence, it pays to understand the concept of interest rates.
Three fundamental factors impact the interest rates:
- Supply – this is the funds available with the savers, primarily households
- Demand – the demand for funds by the businesses to finance business activities
- Government’s net supply and/or demand for funds
Before we see their relationships, we need to distinguish between the nominal interest rate and the real interest rate.
The nominal interest rate is the growth rate of money. In the case of the interest-earning certificate of deposit (CD), it is the interest rate that the bank pays to the depositor. The real interest rate is the growth rate of the purchasing power, which is influenced by inflation.
Let’s say: r = real rate of interest; R is the nominal rate if interest; and i is the inflation rate then
1 + r = ( 1 + R) / ( 1+ i ) or r = ( R – i ) / ( 1+ i )
However, r = R – i, is the commonly used formula but it overstates the interest rate by a factor of (1+ i).
For example, if the interest for the CD is 6% and the rate of inflation is 3% then using the commonly used formula we will get the real rate of interest as 3% = 6% – 3%.
But using the exact formula we will get the real rate of interest as 2.91% = (0.06 – 0.03) / ( 1 + 0.03 ).
So the approximate formula overstates by 0.9%; however, in the case of continuously compounded rate, it equals the exact formula.
 Let’s see how the three factors mentioned above affect the interest rate.
In the accompanying figure, the horizontal axis represents the interest rate, and the horizontal axis represents the quantity of funds. The figure shows the downward-sloping demand curve and upward-sloping supply curve.
The supply curve slopes up from left to right because the supply of funds will be greater at the higher interest rate. The assumption is that the savers will get more value out of investing at higher interest than the consumption of funds.
The demand curve is downward sloping because businesses will reduce their borrowing at a higher interest rate and increase borrowing at a lower interest rate.
The equilibrium is at the intersection of the supply and demand curve, the point E.
The government (and the central banks) can shift the supply and demand curve through fiscal and monetary policies. For example, an increase in government deficit will increase the demand for funds, thus shifting the demand curve to the right, and the new equilibrium point will be E’. Similarly, the central bank can shift the demand curve to the right through expansionary monetary policy. On the other hand, a budget surplus by the government and contractionary monetary policy by the central bank will shift the demand curve to the left and decrease the interest rate.
Investors are concerned with the real return or the increase in their purchasing power. Hence during periods of higher inflation, they expect a higher nominal rate of interest.
Irving Fisher argued that the nominal rate should increase in equal proportion to the expected inflation rate. So if E(i) denote the current expectation of inflation rate, then:
R = r + E(i).
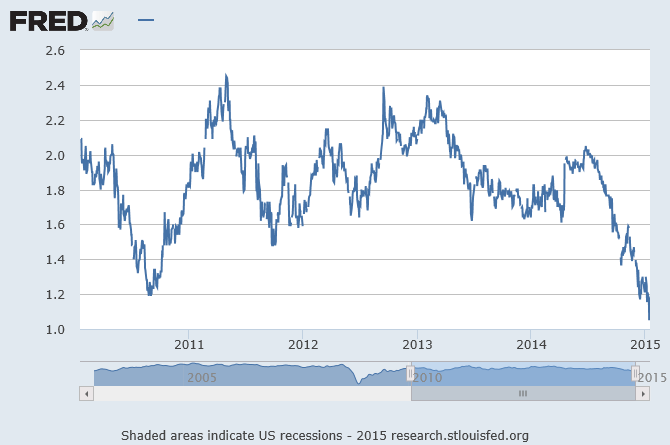
Below is the current market expectation of inflation, as embodied in the 5-year break-even. The sharply falling inflation expectation indicated that the nominal interest rate would not rise – at least not soon.


You must be logged in to post a comment.