Directional Bias For The Day:

- The bias is to the up side, with a strong possibility of a range-bound day
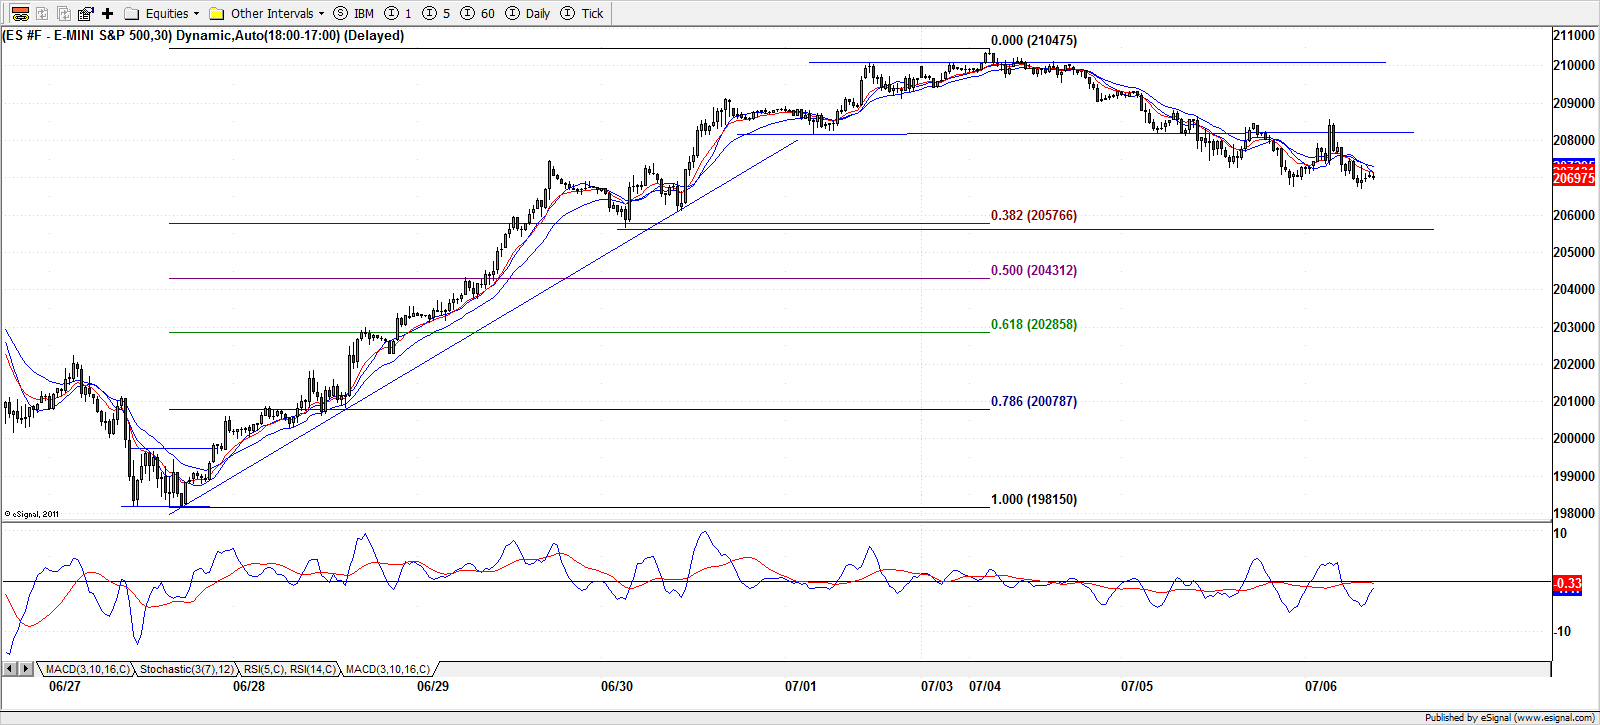
- On 30-minute chart, S&P 500 futures is within a rectangle trading box
- Critical support levels for S&P 500 are 2094.60 and 2090.72
- Critical resistance levels for S&P 500 are 2103.04 and 2108.71;
- Early morning futures price action is indecisive
Before NYSE Session Open
Asian Session
The Asian bourses were mixed overnight.
- Shanghai Composite was down (unchanged) by -0.4457 or -0.01%; after few up days it made a spinning top, more like a doji, indicating indecision; chances of it resolving to the upside are high
- Hang Seng was up +211.63 or +1.03%; it is in the middle of a symmetric triangle
- Nikkei 225 declined by -102.75 or -0.67% after it broke below an up-sloping flag on Tuesday’s gap-down
- Sydney’s S&P/ASX 200 gained +30.40 or +0.58% and made a bullish engulfing on Thursday
- Sensex was up +34.62 or +0.13% after a close day on Wednesday; it made a red harami (close below open) candle within a larger red candle of Tuesday
- South Korea’s Kospi recovered more than half of Wednesday’s loss by gaining +20.96 or +1.07%; it made a green-harami candle within a large red candle of Wednesday
European Session
In pre-US session, European stock markets are mostly down and also near the lows reached post-Brexit vote.
- DAX is up by +38.90 or +0.42%, however, its making a red harami candle within a larger red candle;
- STOXX 600 is up by +1.19% and making a green harami candle within a red candle
- FTSE-100 is up +77.66 or +1.20% after shedding -81.79 on Wednesday
- CAC-40 is up by +1.00%; Italian FTSE MIB is up by +0.27% and Spanish IBEX-35 is up by +0.67% and they all are making chart pattern similar to that of DAX
- Swiss SMI-SWX is up by +0.53% after a gap-up but the last price is below the open for the day;
Currencies
- U.S. Dollar index is marginally up by +0.054 to 96.185; it fell back again within an up-sloping flag with a high point of 96.86 after a spike of Wednesday
- EUR/USD is down up by -18.5 pips to 1.10760;
- GBP/USD is up by +70 pips to 1.2996;earlier it reached a high of 1.3047
- USD/JPY is down by +24.90 pips (Yen is stronger) to 101.14 in a downtrend
- MSCI Emerging Markets Currency Index is up by +0.4%
Commodities
- WTI Crude is up by +0.52 or +1.12% to 47.95; Natural Gas is up by +1.33%
- Gold is down by -3.7 or -0.27% to 1363.40; Silver is down by -0.223 or -1.10% to 19.980
- Copper is down by -0.39% to 2.145
Yields
- U.S. 30-years is marginally up to 2.155 after a record low on Wednesday
- U.S. 10-years is up by 2 basis points to 1.4025 after an all time low on Wednesday
Pivot Levels:
S&P 500 is above its 10-D EMA, 10-D EMA crossed above 20-D EMA and its 20-D EMA is trending above 50-D EMA since March 9, 2016.
| S&P 500 Cash | eMini Futures | |||
| Daily | Level | Break Chance |
Level | Break Chance |
| Pivot | 2091.49 | 2084.75 | ||
| R1 | 2108.96 | 61% | 2103.75 | 57% |
| R2 | 2118.19 | 42% | 2113.50 | 31% |
| R1 | 2135.66 | 44% | 2132.50 | 24% |
| S1 | 2082.26 | 36% | 2075.00 | 36% |
| S2 | 2064.79 | 34% | 2056.00 | 26% |
| S3 | 2055.56 | 23% | 2046.25 | 23% |
Note: The probability of a level breaking is shown above is for the current condition when the price is above 20-D EMA, 10-D EMA is above 20-D EMA and 20-D EMA is above 50-D EMA. R2 break probability comes in picture only when R1 is broken. So are the probabilities calculated for R3, S2 and S3


You must be logged in to post a comment.