We noticed after Tuesday, May 24th, 2016 session that the S&P 500, and other indices, broke out of a bullish-flag pattern. The follow-up to this breakout on Wednesday was quite good. The market opened on the upside and then moved higher, eventually closing strong. For the day, S&P 500 gained 14.48 and Dow Jones Industrial Averages gained 145.46. But the day’s action was not very smooth.
Let’s analyze the Wednesday’s action by taking a look at emini-futures for S&P 500. On Tuesday at 4:00 PM – the end of NYSE session – futures were at 2073.00. By Wednesday morning at 9:30 AM – NYSE open time – they were 8.50 higher and by the end of NYSE session at 4:00 PM, they were up by 14.00 points, which means that during the day’s session they gained only 5.50 points.
Overnight (Tuesday/Wednesday), the futures drifted higher during the Asian and European sessions. By mid-European morning, they had started to form a bullish flag. The price broke out of this formation at 9:30 AM and after that the lows were never tested. The chart below shows how the day progressed on 6-minute time frame.
 The 9:24 AM candle, just before the open, pushed price to a new swing low, testing the support formed by the Tuesday 7:00 PM high. It did not come back to this level again.
The move since the beginning of European session formed an ABCD pattern. Point ‘A’ was the low made by 3:06 AM candlestick at 2078.50, point ‘B’ was the 5:42 AM high of 2085.50 and point ‘C’ was the low of 2080.25 formed by 9:24 AM candlestick. The retracement, BC leg, was 75% of the AB leg. The CD leg was slightly more than 1.618% of AB leg.
The high for the day was reached at 10:18 AM. After that the market carved out a horizontal channel for the rest of the day. Couple of attempts to bounce off the lower limit – once at 1:00 PM and then at 3:00 PM – stalled at the upper limit of the pattern. The last half-hour of the day again brought the price back to the lower limit.

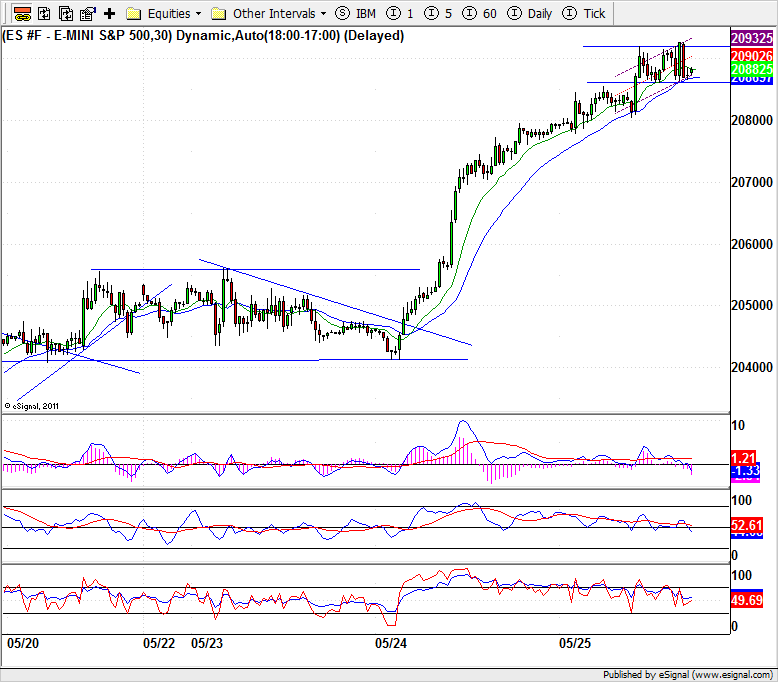
The 30-minute chart above shows that the uptrend is still intact though some troubling signs are appearing. The oscillators – RSI, Stochastic and MACD – are showing negative divergences after the break out from a horizontal channel at 9:30 AM on Tuesday. The price is making higher highs but oscillators have not risen above the high made at the breakout.
On their own, negative divergences alone do not mean that the rally is over. For that, the price has to confirm by forming a reversal pattern and then breaking below it. So far that hasn’t happened. The horizontal channel at the top may of the 30-minute chart has potential to become a topping pattern but for that to happen the price has to break below it convincingly.

Longer term daily chart above shows that there are few resistance levels looming over. It is natural that the price might hesitate before breaking these resistance levels . Chance of a rejection at these levels exists but odds are higher that futures may consolidate here for a while before moving one way or the other. The market-action during the Asian and European session may bring more clarity.
The critical levels for Thursday and the rest of the week are the low made on Tuesday at 9:00 AM before the NYSE session open, the low of 2077.75 made at 2:00 AM before European session and 2092, the high of Wednesday.


You must be logged in to post a comment.